Fast website speed is everything in the online world. If you’ve optimized your website’s loading time, then no one can stop you from increasing your sales and conversion rates. In this article, we’re going to explore the Pingdom website speed test tool and see how you can use it to audit your website’s speed and improve its performance.
Table of Content:
- What is Pingdom?
- Conduct a Website Speed Test
- Understanding Pingdom Website Speed Test Report
- Pingdom Alternatives
- Conclusion- Pingdom is for Beginners
What is Pingdom?
Pingdom (owned by SolarWinds) is a Swedish company that offers a multitude of services such as transaction monitoring, uptime monitoring, server monitoring, page speed monitoring, real user monitoring, etc. It is mostly known for its free website speed test tool that offers quick insight into a site’s page loading speed and how it can be improved.
You don’t need to be a speed performance expert in order to audit your site’s speed through this tool. SolarWinds Pingdom is quite effortless to use, and the improvement recommendations are easy to understand, even if you don’t have any technical background.
How to Conduct a Pingdom Website Speed Test?
Running a speed test on Pingdom can be done in three simple steps:
- Add your website’s URL in the box located on the tool page.
- Select the location you want to run the test from.
- Click on ‘Run Test‘.

Currently, Pingdom allows you to conduct tests from 7 different locations:
- Asia – Japan – Tokyo
- Europe – Germany – Frankfurt
- Europe – the United Kingdom – London
- North America – USA – Washington D.C.
- North America – USA – San Fransisco
- Pacific – Australia – Sydney
- South America – Brazil – São Paulo
It is advised to choose a location closest to your target audience’s geographical location. This way, you’ll be able to understand how your site loads from the point of view of your customers.
However, if you have an audience that is spread across the globe, then you should conduct tests from each of the available locations to get a more accurate picture.
Understanding Pingdom Website Speed Test Report
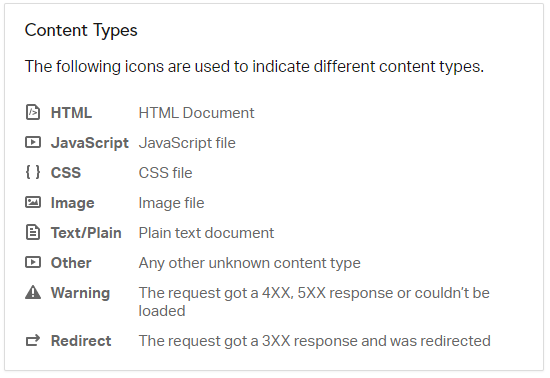
Before we move on to understanding the Pingdom speed test results, here are a few symbols used throughout the test results:
1. Overall Result
Once you’ve hit the ‘Run Test’ tab, Pingdom will generate a test report after a buffer time of a few seconds. The very first panel of your test report will show this:
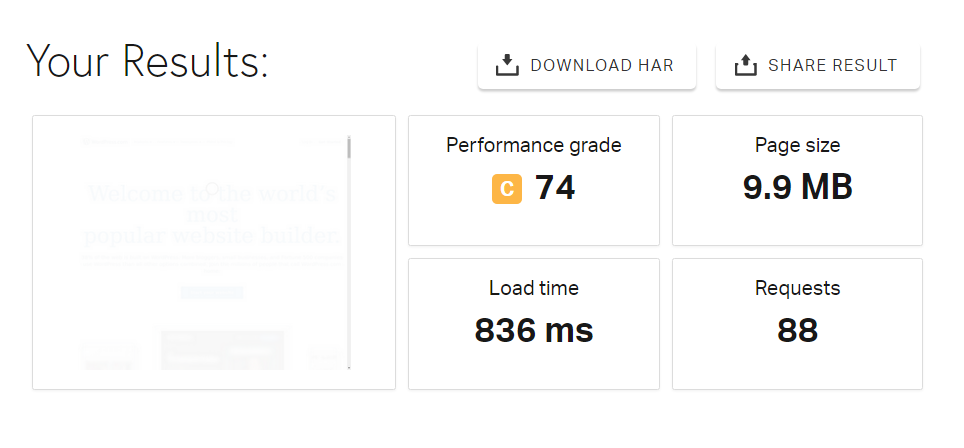
1. Performance Grade: overall speed & performance of your website, where a score between 60-70 is graded D, 70-80 is graded C, 80-90 is graded B and so on.
2. Page Size: the weight of your entire page and its content measured in MegaBytes.
3. Load time: Pingdom considers a website’s onload time as the page load time. Onload time is the time taken to download all the resources on your website (for example, the content and images). However, some events such as a JavaScript code are excluded.
4. Requests: this refers to the number of HTTP requests your site needs.
2. Improve Page Performance
This next section, is the most important part of your report, as it lays down the ways in which you can improve your store’s performance. People often pay too much attention to the overall performance grade of their site. Remember that making improvements to your site is more important than getting a perfect score.
This is why your focus should always be on improvement recommendations. Analyze them carefully to gauge where your store is lacking, and fix those issues. It’s okay if some suggestions are impractical or hard to employ for your website.
Pingdom website speed test gives 7-speed optimization suggestions for each website. These suggestions can vary from website to website, a few common ones are listed below:
- Reduce DNS Lookups
- Add Expires headers
- Make fewer HTTP requests
- Avoid URL redirects
- Use cookie-free domains
- Compress components with gzip
- Configure entity tags (ETags)
- Put JavaScript at bottom
- Avoid empty src or href
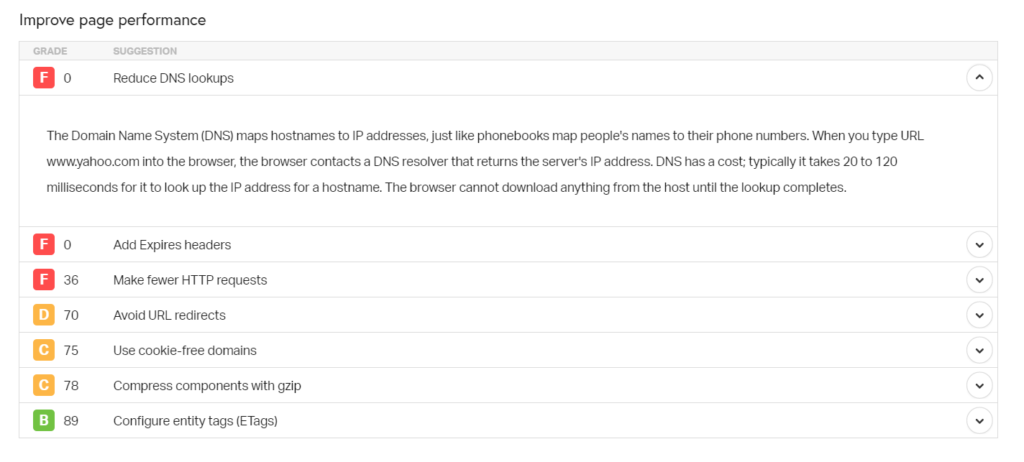
As you can see in the image, Pingdom grades how well your website is employing each speed optimization technique. You can click on the downward arrow on the right to see what each suggestion means.
For your convenience, I’ll explain some of the most common suggestions most websites get:
2.1. Avoid URL Redirects:
The ‘300’ class of redirects usually takes a user to a different link than the one they clicked on. Simple 301 redirects are harmless. But if you use too many redirect codes, then your site’s speed and performance will be negatively affected.
2.2. Add Expires Headers
Expires headers tell the browser whether it should request a specific resource from the site’s server or grab it from its own cache storage. These reduce the request load on servers, which increases your page’s load speed. Moreover, the cached information is fetched faster by browsers, further reducing a web page’s load time.
2.3. Use Cookie-Free Domains
When a browser asks for static content, it sends cookies along with the request. Meaning, cookie headers add up to HTTP requests. Moreover, they are of no use to servers and create unnecessary traffic. A cookie-free domain doesn’t request or serve any cookies to browsers.
You can serve all the static content (images, CSS, scripts, etc) without having the users waste bandwidth on sending cookies to the server.
2.4. Compress Components with GZIP
Gzip is the method used to shrink the size of text-based files like HTML, CSS, JS, etc. Pingdom will issue this warning if it finds that text-based components of your page have not been compressed.
3. Response Codes
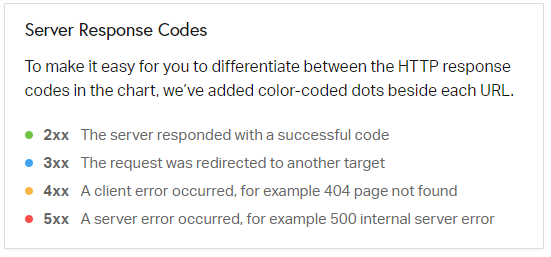
Response codes are essentially HTTP status codes, which communicate whether a particular server request has been successfully completed. They basically tell you if the resources on your website are loading without error or not.
These have been divided into five classes:
- Informational responses (100–199),
- Successful responses (200–299),
- Redirects (300–399),
- Client errors (400–499),
- Server errors (500- 599)
The 200 and 100 response codes are fine. However, any 400 or 500 response codes detected during the audit must be eliminated. This is how Pingdom shows you response codes:

The above image showcases that out of 53 HTTP requests made (one for each resource on the page), one resource failed to load and showed a ‘500’ internal server error.
4. Content & Request Breakdown
In this section, you can see a complete breakdown of content size and requests by:
4.1. Content-Type

This chart depicts the portion of space taken up by each resource on your page. You can identify which content elements are taking up too much of your page’s resources, and try to optimize their size.
For example, in the above chart, images are occupying 58.09% of the webpage’s resources, which is way above the 42% images usually take. Compressing images, in this case, could definitely improve this site’s speed. Moreover, 51 requests need to be made in order to load images on this page. Removing some images could also help reduce the page’s loading time.
4.2. Domain
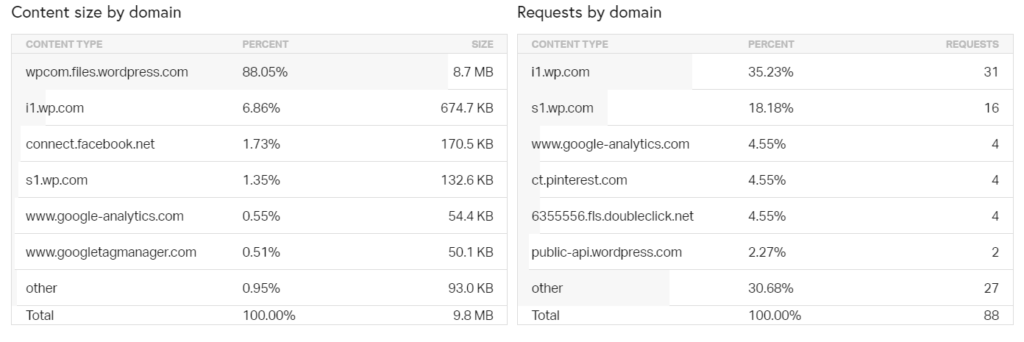
The breakdown of content size and requests by domain shows you the external services or scripts your website uses. For example, WordPress makes external calls to Google Analytics, Facebook, and Pinterest in the above example. These third-party requests depend on the services your website uses.
Usually, it’s recommended to keep external calls to a minimum; the lower the better. This is because loading content or code from outside parties could create certain issues like DNS lookups. delayed TLS handshakes, etc, which will further slow your website’s loading speed.
5. File Requests (Waterfall Chart)
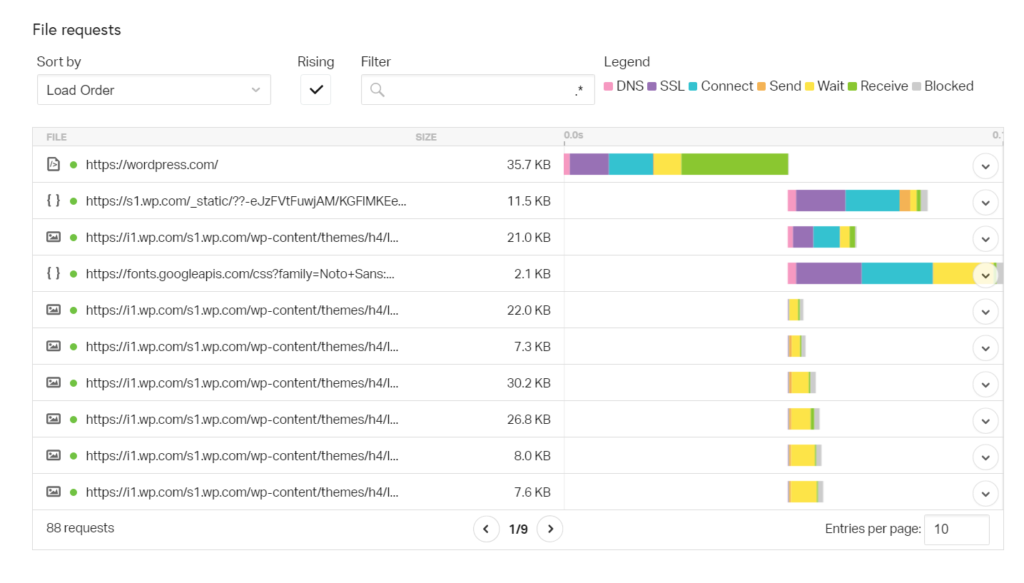
A Waterfall chart gives you a deeper look into your site’s speed by dissecting each and every HTTP request a browser makes to your website’s server.
In order to load every asset on your webpage (content, images, HTML scripts, JavaScripts, CSS, etc), an HTTP request is made to your site’s server. This means, if the total number of ‘requests’ made for your website is 42, then there are 42 distinct assets on your web page.
Each HTTP request follows a series of steps before it is successfully completed or a ‘200 ok’ response is given. A Waterfall chart is a visual representation of the amount of time taken to complete each step, for every HTTP request.
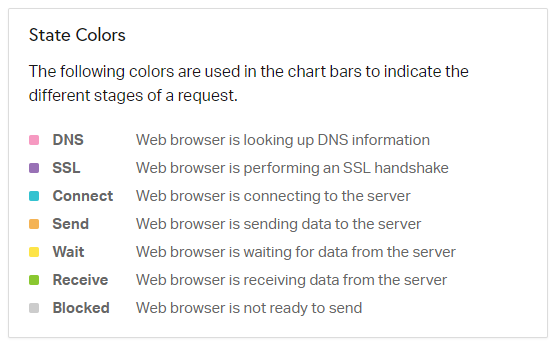
Pingdom’s waterfall chart divides each HTTP request into the following steps:
- DNS: Time taken to look up the Domain Name Server and find the IP address corresponding to your site’s domain name
- SSL: the amount of time taken to complete an SSL/TLS handshake
- Connect: Total time taken to establish a TCP connection
- Send: Time taken by the browser to send the request data to the server
- Wait: refers to the Time To First Byte (TTFB), which is the amount of time a browser has to wait before it receives the first byte of data from the server
- Receive: time taken to download website content
Each of the above steps is denoted by different colours in the Waterfall analysis. Look for long bars of these colours on the chart.
For example, in the image above, a long blue bar indicates that the ‘connect’ time is a bit longer than it should be. Appropriate measures should be taken to identify why this is happening and resolve the issue.
Pingdom Alternatives Free & Paid
Conclusion- Pingdom Speed Check Tool
Pingdom’s free plan is very easy-to-use and comprehends, which is why it is mostly suitable for beginners. If you have a more advanced understanding of website speed testing, then it’s better to use tools like GTmetrix, which offers more advanced features in their free plan.
Pingdom doesn’t give the option to test your website’s speed across devices (mobile, desktop, tab). Moreover, it only calculates the onload time to determine your website’s load speed. Whereas tools like Google Pagespeed Insights use more advanced metrics like contentful paint, largest contentful paint, speed index, etc to test your site’s performance.
The area where Pingdom really shines is its paid plan, which offers advanced features like:
- Visitor Insights
- Uptime Monitoring
- Advanced Pagespeed Insights
- Transaction reports
So, if you’re just starting out and want to get a basic understanding of your site’s speed, then Pingdom is the perfect tool for you.
If you have any queries or feedback, do mention them in the comments below!
Read Next: Advantages of SSD over HDD: A Detailed Comparison

Sakshi takes care of everything related to Marketing at Webscoot.io. She has knowledge about Magento, WordPress, and Dogs.



Speed Test Pingdom tool very is well explained here, kudos to the writer for this well defined article on page speed test Pingdom. I was figuring out to understand it but then I stumbled upon this wonderful article of site speed test Pingdom.