In this article, we’re going to explore GTmetrix-speed-test in detail, and give you a complete understanding of how the tool works, how it compiles reports, and what its reports indicate. So let’s begin!
Webmasters can easily find a lot of speed test tools to get a full-blown analysis of their website’s speed and performance. These tools score your website on the basis of different metrics and give recommendations for improvement.
Table of Content:
- What is GTmetrix?
- Factors to Consider While Conducting a GTmetrix Speed Test
- Understanding a GTmetrix Speed Test and how to use it
- Basic user test
- Registered user test (free)
- Understanding the Advanced Analysis Option
- Conclusion
What is GTmetrix?

Gtmetrix is a performance analytics tool, that generates a full report on your website’s speed and provides improvement recommendations. It is one of the most popular speed testing tools after Pingdom and is easy to use for beginners.
The basic plan is free, but if you want to use advanced features like resource usage graphs, then you’ll have to try GTmetrix’s paid plans, starting at $14.95/mo with the bronze plan.
GTmetrix consolidates results from Google PageSpeed Insights and Yslow to generate a performance report card and recommendations. So basically it covers a wide range of metrics, which is why you might not need to turn to any other tool for the performance testing of your website.
Factors to Consider While Conducting a GTmetrix Speed Test
Conducting a speed test is not easy. You can’t simply conduct a solitary test and expect to get accurate results and helpful insights. The key is to run multiple tests and play with multiple factors for a more in-depth analysis.
Here are a few factors you must consider:
1. Test Locations
The location of your speed test ( your visitors) and its proximity to your site plays a big role in how your fast your site will and how well it will perform.
It is advised to pick a location that’s near your actual target audience, and the physical location of your website server. Note that ideally, these two locations are in proximity with each other for faster loading speed.
If your target visitors come from one location, then ideally that is the location you need to test your website from.
However, if your audience is spread across the globe, then pick up four to five testing servers in important locations around the world. For example, pick one server from the US, one from Asia, one from Europe, and one from Australia, etc. The more spread out your servers are, the more accurate your test results will be.
If you’re observing a subpar load time for some regions, then it may be an indication that you need to start using a Content Delivery Network or CDN.
2. Devices to Test
A lot of people only test their site for desktop devices, and don’t take mobile speed into consideration. It’s very important for sites today to be optimized for mobile devices, as search engines consider this an important ranking factor. Also, around 50% of internet traffic are essentially mobile users.
Site speed can vary across various devices, depending on the content of your website. For example, low powered mobile devices might take longer to load or process JavaScript-heavy pages, as compared to laptops or computers. So, if you have a lot of JS on your web pages, then it will load faster on computers and slower on mobile.
Moreover, people often use their sim card data with less bandwidth while browsing on their phones, leading to slower load times.
So, in order to get the full picture, you need to test your site across various devices and connection speeds. In GTmetrix, various connection speeds can be tested for free, but for mobile devices, you will have to sign up for a premium account.
3. Target Site Pages
Simply testing the homepage of your website will not fully reflect your site’s performance. For starters, it’s possible that the your homepage contains less amount of heavy code scripts as compared to other pages, making it appear that your site is fast.
Moreover, a lot of times it is the product pages that often rank and attract maximum traffic, which is means that the loading speed of your product pages is more important than the homepage!
This is why it is recommended to test all the single pages on your site as well (product pages, blogs, store pages, etc), apart from the homepage.
4. Number of Tests
The last important factor in a GTmetrix speed test is the number of tests you should conduct so that your test result is closer to the reality.
You definitely need to conduct tests during different times in the day, as traffic intensity varies during the day depending on the exact time, which weekday it is, etc. If you’re on a shared host, then your site speed will also vary depending on the amount of resources your server is able to alot to your site during different times in the day.
For best results, you should conduct hourly tests for about a week or so. However, sufficient insights can be gained from running 5-10 tests over an hour or two. Your load speed in seconds might change during the course of a day or a week, but a lot of GTmetrix recommendations might not change with time.
Understanding a GTmetrix Speed Test and How to Use it

1. Basic user test
The basic plan is free. You can simply visit the main page of the tool, enter the URL of your website and get a full analysis right away. However, using the tool as an anonymous guest offers little flexibility.
For example, a basic speed test forces you to use the following configuration:
- Test location: Vancouver, Canada
- Test uses an ultra-fast connection speed
- The test is done for a desktop chrome browser
You might not be targeting a Canadian audience, which is why a basic test will not reveal a precise and real picture. This is why, it is advised to register as a user for free, and then conduct a test.
2. Registered user test (free)
When you register as a free user, you get to customize the following:
- Test devices: you can test for Chrome and Firefox (both desktop devices) for free. If you have a paid plan, you have the option of testing Chrome on a Galaxy Nexus Android Device.
- Connection speed: different Broadband options down to 56k
- Location: you can test your site from Hong Kong (China), Mumbai (India), Sydney (Australia), Sao Paulo (Brazil), Vancouver (Canada), London (UK), Dallas (USA)
After creating your free account you need to:
- Enter your site’s URL in the bar/box.
- Select the test format according to your needs and preferences (location, connection speed, devices, etc).
- Once you’ve made all the desired configurations, click on Analyze.
Once your test completes running, a summary box with five pieces of information will appear:
- Page Speed Score: the performance of your website according to Google PageSpeed Insights, denoted by a score ranging from 1-100. A score above 90 is usually considered good.
- Yslow Score: an approximation of your site’s speed performance according to Yslow’s metrics.
- Fully Loaded time: the amount of time (in seconds) it takes your site to load.
- Total Page Size: how large the page you have tested is (smaller size means faster loading speed)
- Requests: how many HTTP requests your site needs (lower is better)
Also note that on the side of all these scores, you will see the following symbols:
- The green upward-pointing arrow means that your result is better than average.
- The red downward-pointing arrow indicates that your result is worse than the average.
- The orange diamond icon indicates that your result is within +/- 5% of the average
3. Understanding the Advanced Analysis Option
Under advanced analysis, you will be shown six tabs. We will dissect them each one by one in this section:
A. PageSpeed
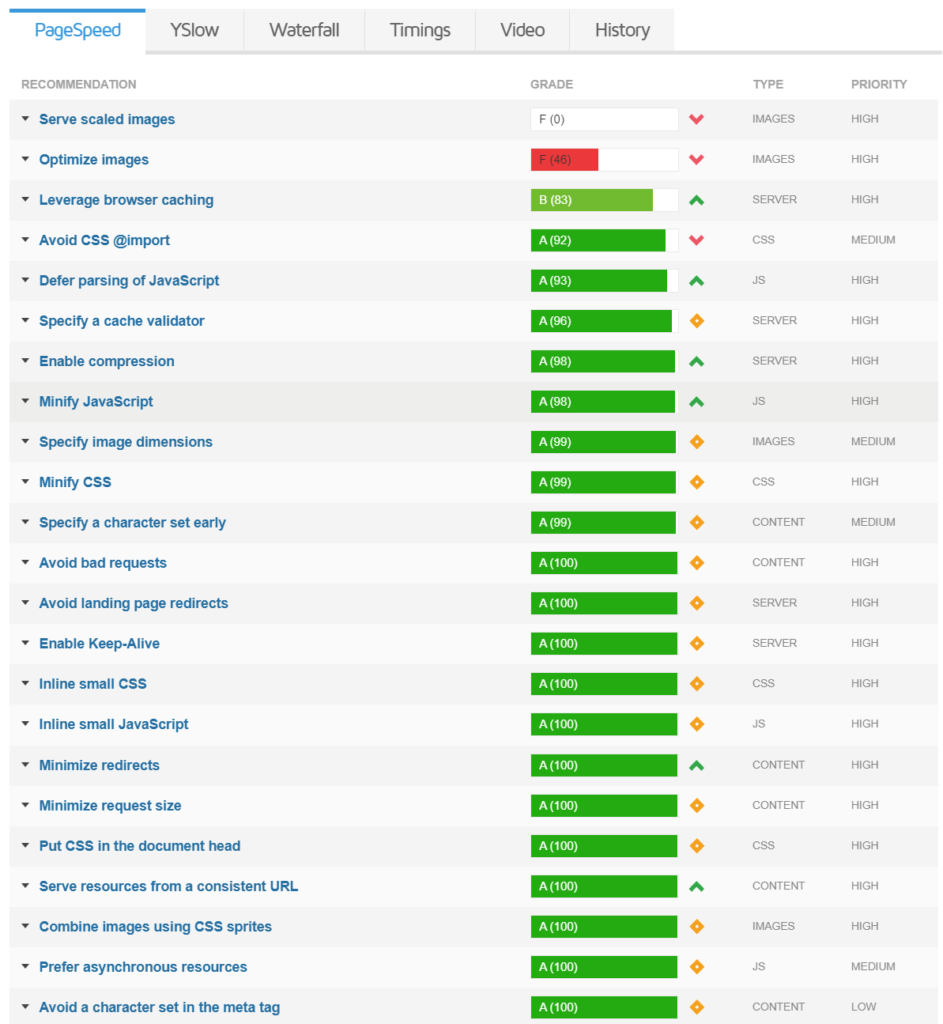
Google PageSpeed Insight gives your website a performance score from 0 to 100, and a maximum of 25 recommendations for improvement.

PageSpeed uses Google’s Lighthouse to calculates data on the basis of:
- Lab data that is collected in a controlled environment and it estimates a website’s performance based on various metrics like First Contentful Paint, Largest Contentful Paint, Speed Index, Cumulative Layout Shift, Time to Interactive, and Total Blocking Time.
- Real-world field data which captures the actual-world bottlenecks in the website’s performance, as well as user experience it offers in reality. It also delivers data based on certain metrics like First Contentful Paint, First Input Delay, Largest Contentful Paint, and Cumulative Layout Shift.
Some of the common recommendations it gives to users are:
- Eliminate render blocking resources
- Remove unused CSS
- Minify HTML, JavaScript, CSS
- Minimize Main Thread Work
- Optimizing Images
If you want to know about PageSpeed Insights in detail then you can read the following article:
B. YSLOW
YSLOW is also a website speed test tool that scores your website’s loading speed and gives around 15 recommendations for improvement. The metrics or factors YSLOW uses are similar to those of PageSpeed.
You’ll see an arrow beside each recommendation. You can expand that arrow to see what each recommendation means for your website and how you can employ it. Some suggestions are graded as more important than others, which can be seen under the ‘priority’ tab.
Always remember that it is not important to run after the ‘score‘ every tool is giving your website. Stress more on the recommendations these tools display, and carefully analyze them to understand which suggestions will actually improve your site’s performance.
C. The GTmetrix Waterfall Chart
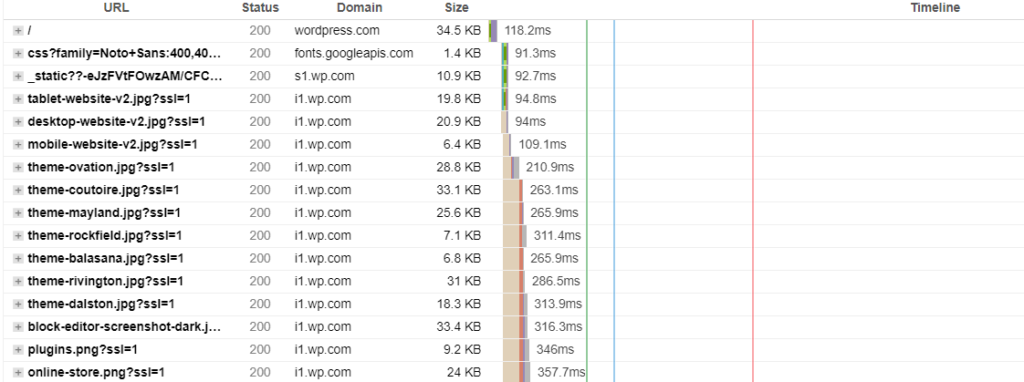
The Waterfall chart gives you a deeper insight by exposing the exact bottlenecks in your website’s loading speed. However, this chart might be slightly tough for beginners to understand.
In simple terms, every asset that your web page consists of is essentially an HTTP request made to your site server. By assets I mean the content, image files, CSS stylesheet, HTML script, etc.
Remember the ‘Requests’ tab that your basic test summary shows? If there are ’35 requests’ on that tab, then it indicates that there are 35 distinct assets on your webpage that need to be loaded by browsers. This means that your Waterfall chart will analyze all these 35 distinct elements individually.

There are a series of steps involved in loading each and every asset on your website. Each bar on the Waterfall graph displays each step involved in loading an asset, and the amount of time that step took.
Following are the steps each asset goes through:
- DNS Lookup: Time taken to lookup the Domain Name Server and find the IP address corresponding your site’s domain name.
- Connecting: total time taken to establish a TCP connection
- Sending: time taken by the browser to send the request data to the server
- Waiting: refers to the Time To First Byte (TTFB), which is the amount of time a browser has to wait before it receives the first byte of data from the server
- Receiving: time taken to download website content
The Waterfall chart is perhaps the most technical aspect of your GTmetrix speed test. But thankfully, GTmetrix provides a comprehensive guide on how properly read the Waterfall chart. You can find this guide in the Waterfall graph section itself.
D. Timings
Page load time is usually believed to have a single definition. Meaning, a page is considered to be fully loaded when all the assets have been processed and there is no more downloading to do.
However, in the real world, there are various definitions to when you can consider a page as ‘loaded’. For example, a normal visitor will mostly care about the amount of time your site takes to display some content on the page.
As soon as something becomes visible on your webpage (even if it is just 50% of your page’s total assets), your users will perceive your website to be ‘loaded’. This means that you website will appear to load faster than it actually does!
The Timings tab takes all these different factors into consideration and displays:
- Time to first byte (TTFB)
- First paint
- First contentful paint
- DOM interactive
- DOM loaded
- Onload
E. Video
The Video tab helps you understand how your web page loads for actual visitors by recording a video. You can slow down the video speed by 4 times to identify the bottlenecks easily. It also displays a Filmstrip view that gives you a frame-by-frame view of your page load.
This feature can help you figure out how much time it takes for first content to be visible, if there are any flashes of unstyled content (jumping texts and fonts), etc.
F. History
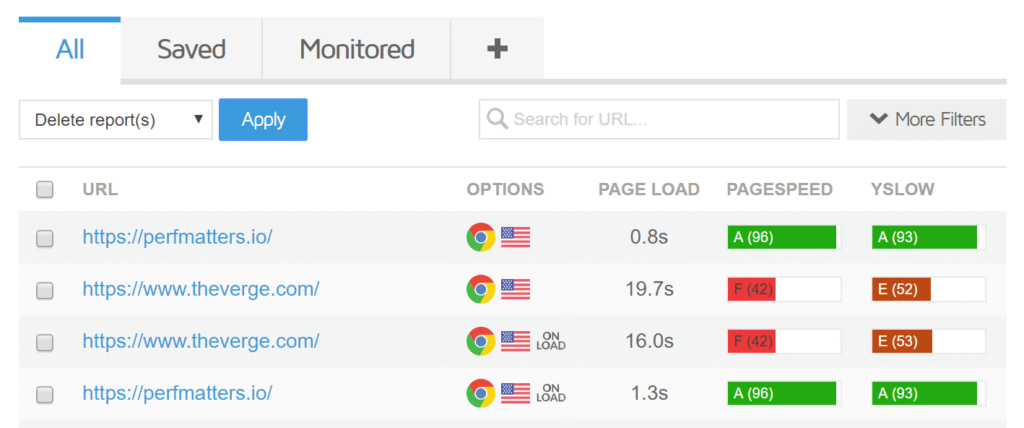
Under this tab, you can view the results for all the speed tests you have conducted. Free accounts have a limit to the number of tests they can save. You can compare old tests with new ones side-by-side, which is an impressive feature.

Conclusion
GTmetrix speed test offers a very comprehensive analysis of your website’s performance. It leans towards an all-in-one solution, as it saves you from the hassle of testing your site on different tools, compiling reports, and then making sense of them to see what improvements can be made.
You will not have to look at other speed test tools for more details, in my opinion.
If you have any queries or feedback, do mention in the comments below!

Divya loves writing and is passionate about marketing. When not trying to hone her skills, you’ll find her either reading or binging on TV shows.


Nice article. Thanks for the guide. I was able to get above 95 on Gmetrix but google pagespeed is a mess.