

Performing a server health check up on regular basis will help you identify any server-related issues ahead of time.
“Web Server health” usually indicates whether the server is “healthy” or “unhealthy.”
In this article, you’ll discover how to verify the health of a server and how to perform a server health check in 5 easy steps.
When it comes to monitoring and measuring operational health, many business owners forget the core of their network—the server infrastructure.
Many people are unaware of the performance of their web servers until it becomes slow or unavailable.
You can spot unexpected behaviour, such as increased resource use, which could be a symptom of infection if you closely monitor your systems. If you work with a managed host, they identify the potential problem ahead of time and resolve it before you lose traffic.
That said, 53% of all successful cyber attacks go unnoticed, and any firm may profit from early detection. Furthermore, 91% of all security concerns do not result in an alert.
Let’s start right on!
Table of Contents
- What is Web Server Health?
- What is Web Server Health Check?
- Importance Of Web Service Health Check Up?
- How To Perform A Server Health Check-Up
- How Often to Perform a Server’s Health Check
- Top Server Health Check Software
- Final Words
1. What is Web Server Health?
The health of a server relates to how well it performs.
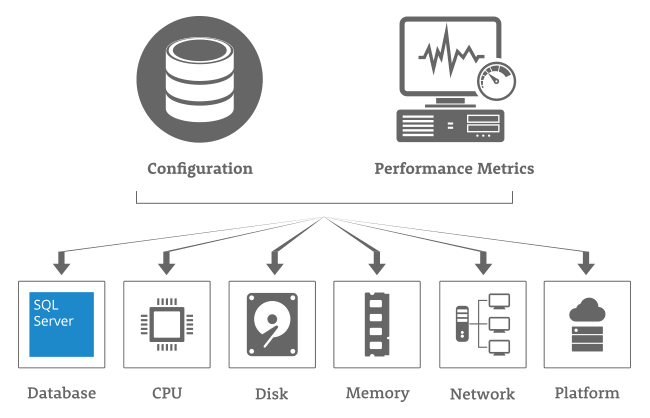
When it comes to web server health, each part has its own set of evaluation criteria. CPU use, RAM availability, and disc capacity may all be examined physically. Connectivity, dependency, and anomaly evaluation are examples of other tests.
The baseline is then utilized to detect variations that can be addressed to achieve the best possible results.
2. What is Server Health Check?
A server health check is a process of examining and generating a full overview of the performance and status of your servers.
Monitoring hardware specifications, metrics, and server performance statistics are just a few of the operations.
A server health check also aids in the monitoring of CPU usage, memory usage, power consumption, and component performance to avoid downtime.
Monitoring your servers can help you avoid system breakdowns, improve performance, and assure high availability.
In the majority of firms, IT infrastructure is vital. The repercussions of any failure of your infrastructure servers can be disastrous.
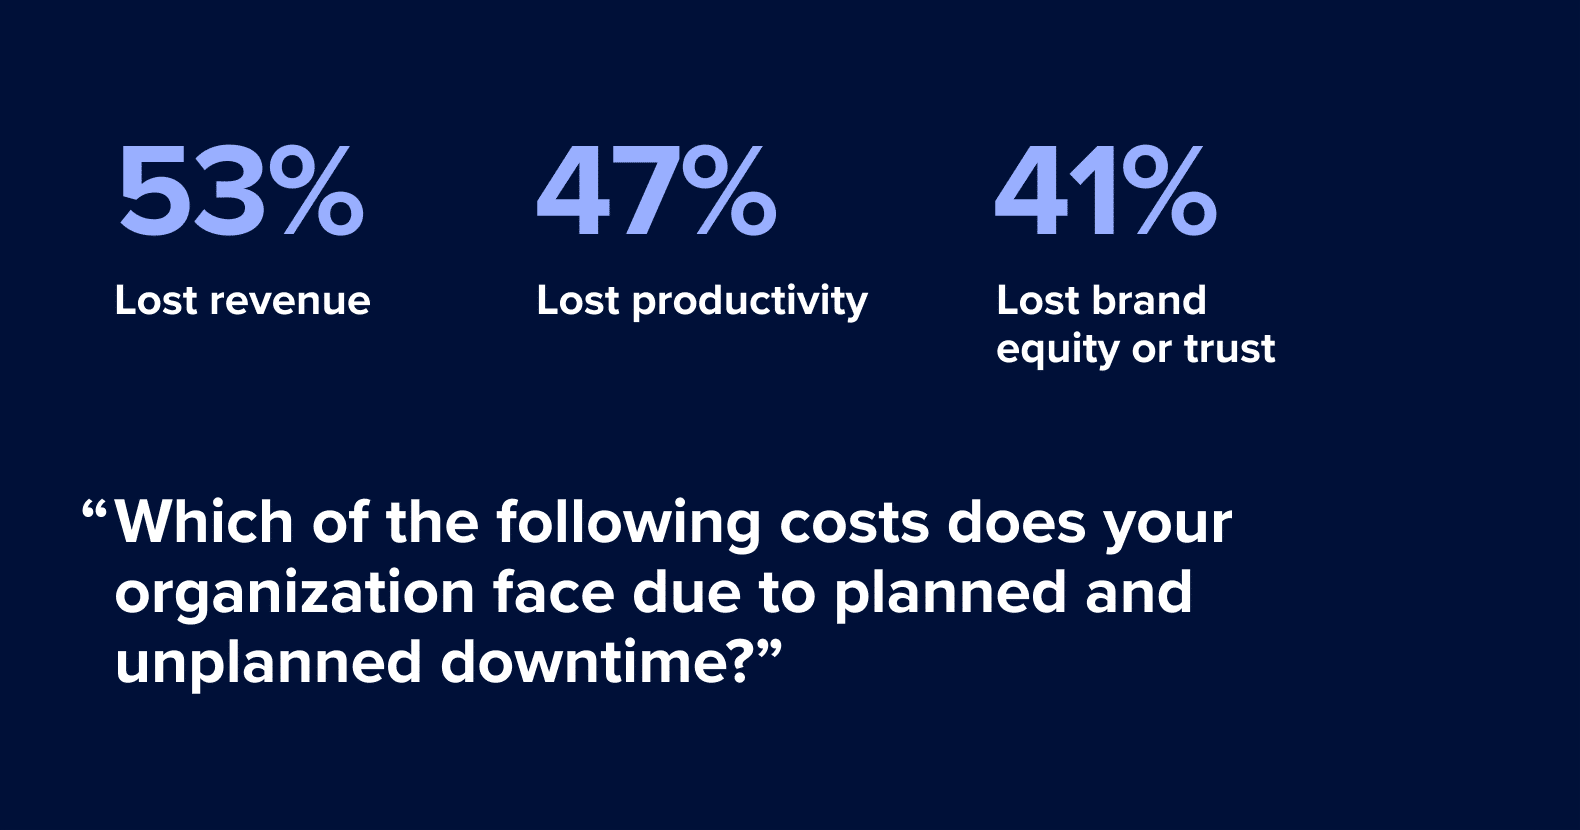
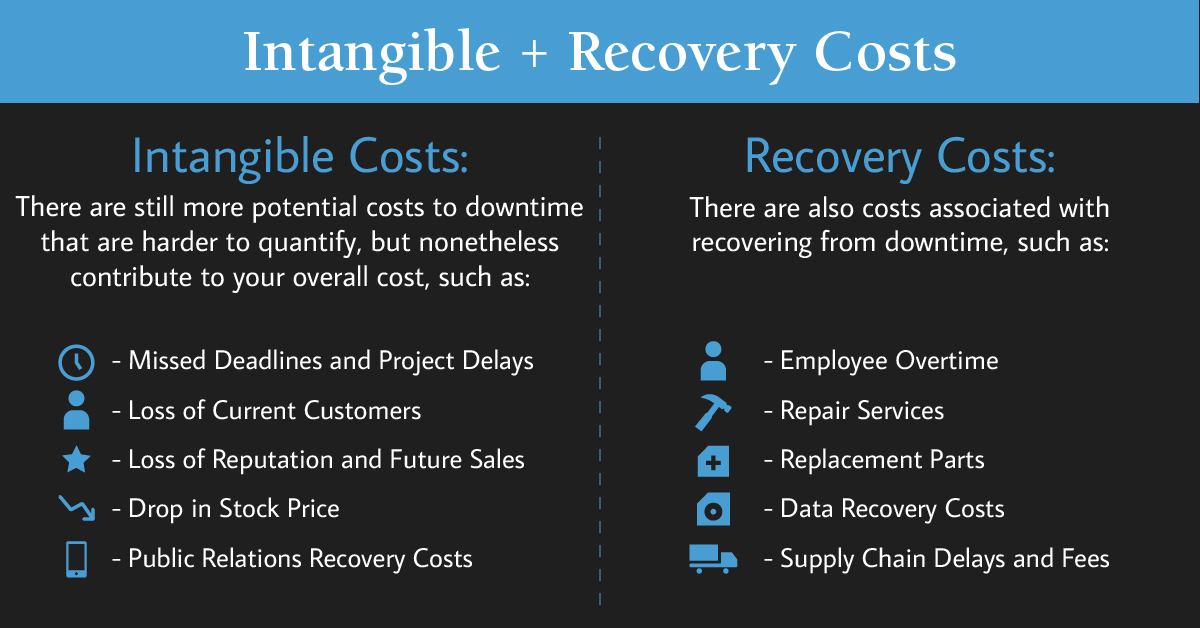
It can, for example, lead to low productivity, significant downtime, and revenue losses, as well as security breaches and a negative brand image.
That’s why automating your IT infrastructure, development, compliance, security, and configurations, as well as testing and deployment, is critical.
3. Importance of Web Service Health Check Up
Recognizing how servers work is critical to the success of any organization.
Servers can fail abruptly or behave erratically if they are not checked regularly. A server failure that causes unexpected downtime can be costly.
Unplanned downtime can cost up to $100,000 per hour, according to estimates.
Given that the average security breach takes over 200 days to detect, adopting a server health check tool can drastically reduce the number of times attackers can freely wander your network.
Monitoring the health of a server gives information that you can use to predict future issues.
Companies can detect potential errors and address them before they harm the bottom line by analyzing current and historical data.
Monitoring data can also be used to make informed decisions about server replacement, performance optimization, and operational modifications.
4. How To Perform A Server Health Check-Up?
How a health check is performed is determined by the server health checklist.
Certain physical capabilities apply regardless of server type; however, performance measures for a SQL Server health check differ from those for an application server.
The following should be delivered by an infrastructure check that tests server and network functionality:
4.1. Hardware metrics – fans, power supplies, disc drives, CPU, storage, memory, and ambient conditions.
4.2. Reports – Data about procurement, usage, and status that can be used to make future purchases.
4.3. Alarms – Notifications of changes in the health of the server for faster resolution.
4.4. Baselines – Historical metrics used to determine alarm levels.
4.5. Visualization — Instead of only reporting, a graphical representation is used to provide a quick server health evaluation.
Although the checks may differ, here are some critical server health evaluations to perform;
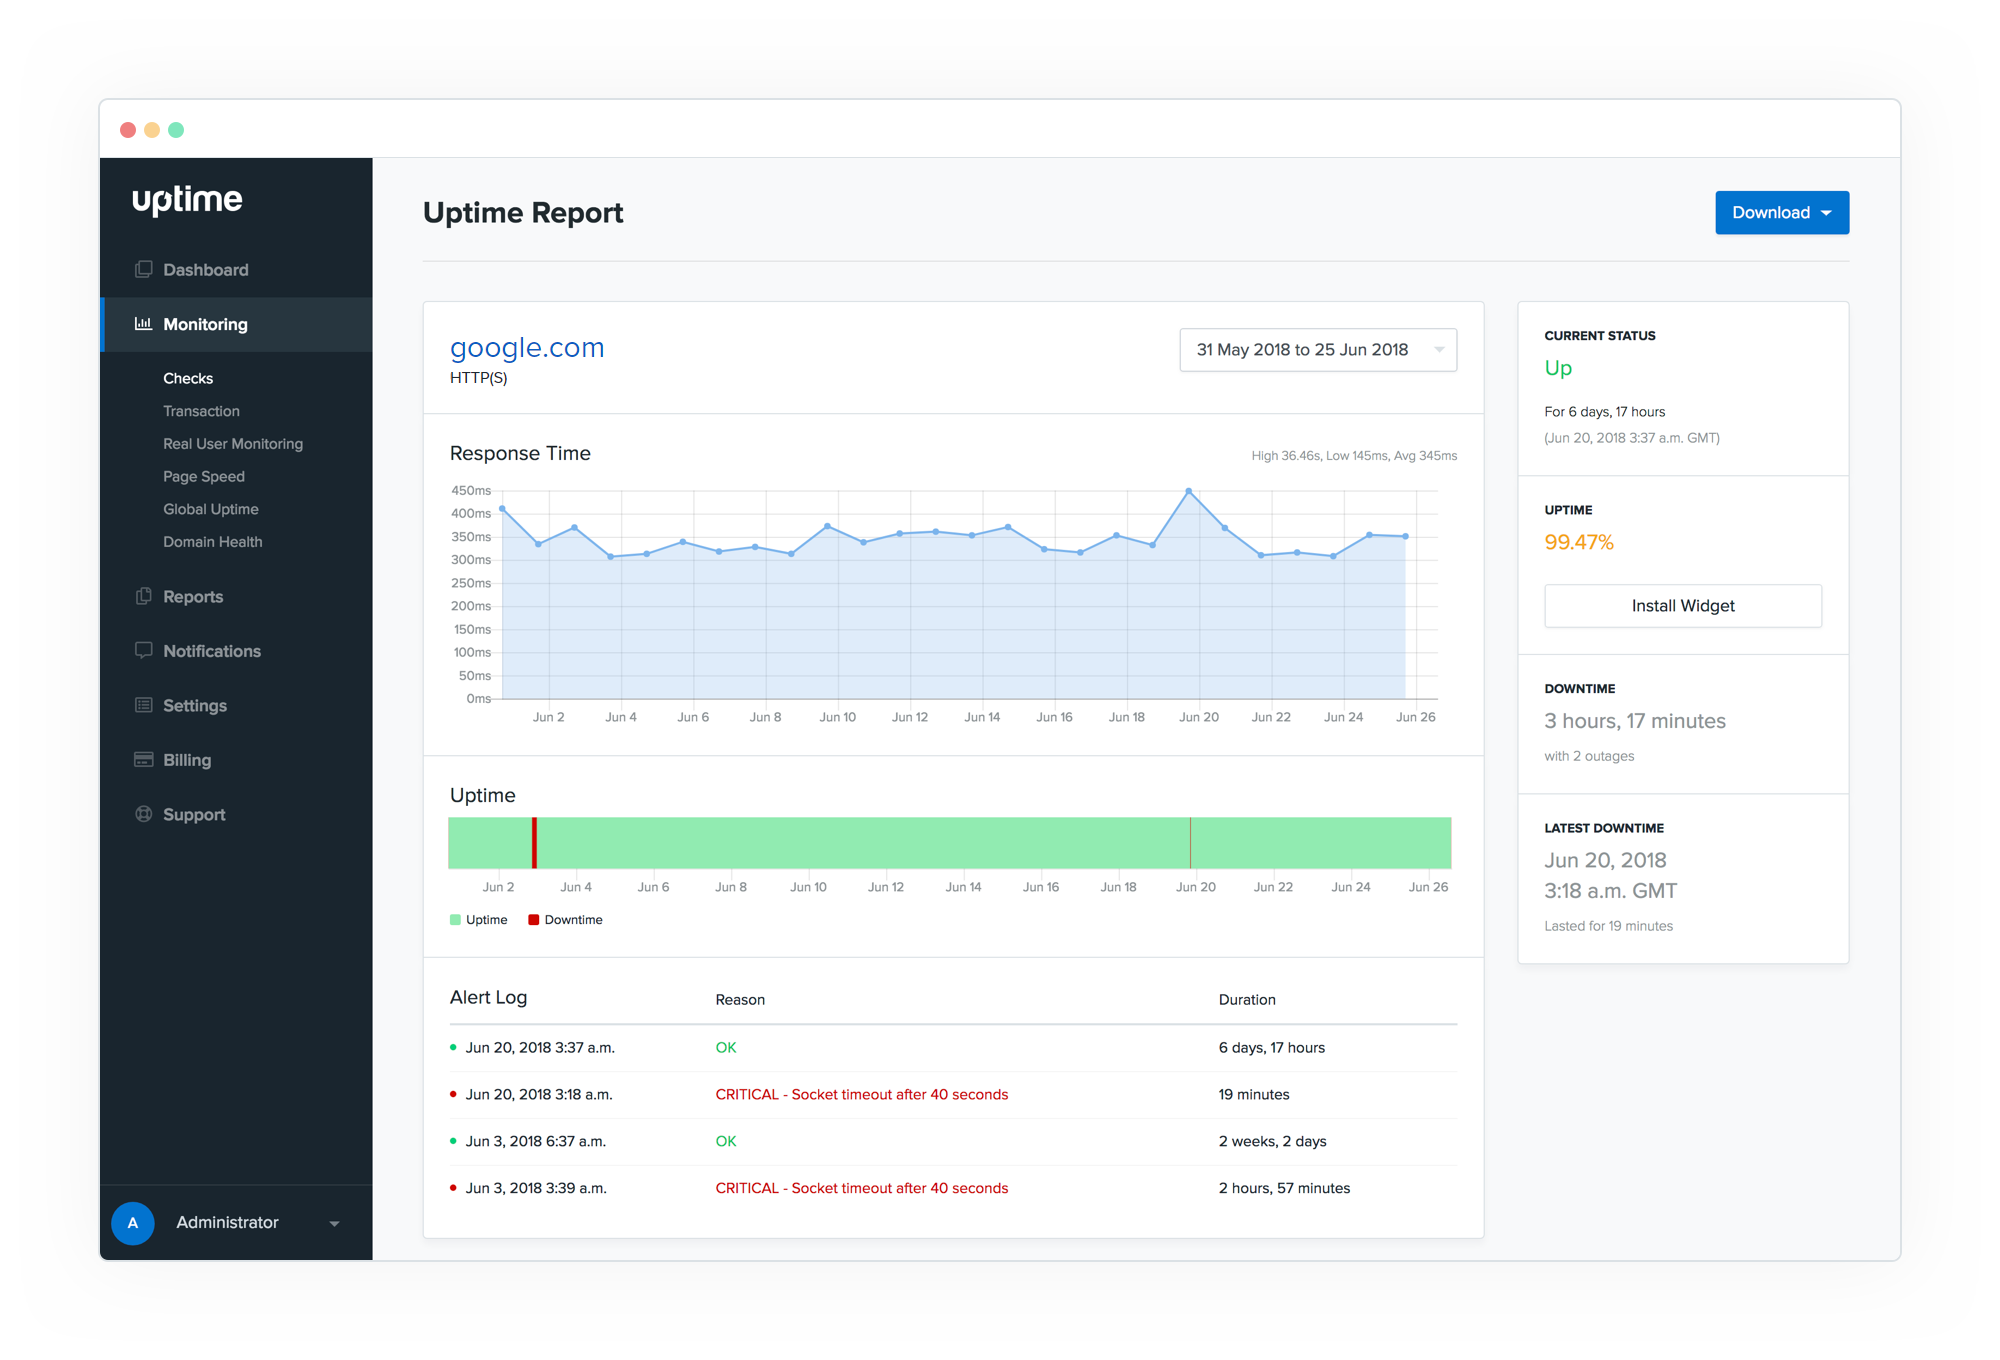
#1. Uptime Checks
If your website is down, your customers won’t be able to connect with you.
That said, downtime can burn some big bucks.
Because servers are part of the network’s infrastructure, their ability to connect is an important metric to test.
These tests can be carried out with the help of a load balancer or an external monitoring agent.
At the very least, the tests should include:
- Confirm that the server is listening on the anticipated port and that new connections are being made.
- Executing HTTP queries to confirm that the server answers within the baseline parameters.
- Ensure that fundamental statuses are sent.
- Pinging the server is a simple test that may be used to determine whether the configuration is functional.
#2. Local Health Checks
Local health checks ensure that the server can run applications.
It guarantees that the resources needed to ensure application performance is available.
Their checks include the following:
Operation Functioning – Liveness checks may test proxy processes, but they may not examine the proxy application link. Local health checks go beyond the fundamentals to ensure that operations are working smoothly.
Missing Processes — Verifies that support processes are up and running. Organizations risk having a service fail if monitoring does not go deep enough to check support processes. These issues can be difficult to recognize and remediate at times.
Read and Write to Disk — For logging or error tracking, most applications write to a disc. When software attempts to access a resource that is not available, assuming that disc access is not necessary can potentially lead to perilous results.
#3. Dependency Checks
You may learn how your server interacts with other components by doing dependency checks of the sql server health check checklist.
Your application might, for example, need to transfer data to a SQL server. The application may fail to function properly if the two servers cannot communicate.
Dependency checks also include;
A dependency check can recognize expired credentials or improperly configured servers that prohibit an application from connecting to a database server.
Dependency checks can also assist with server patch management, ensuring that all patches are current.
Checking for misconfigurations or metadata can uncover disconnects that lead to unanticipated behaviour.
On a dependency server, for example, automated updates have ceased operating, but the server has no idea why.
Detecting misconfigurations or missing metadata can help guarantee that servers continue to function properly.
Network behaviour may result in difficult-to-detect discrepancies, resulting in network instability, when servers are unable to communicate with one another.
Software flaws can cause memory leaks or data corruption, causing server performance to suffer.
The possibility of fatal mistakes is reduced by checking to verify that server performance is maintained.
#4. Anomaly Checks
Anomalies should always be taken seriously, you never know what the anomaly can turn into.
Any type of server performance monitoring should include an anomaly check to see if a server is acting differently from its baseline or similar servers in the network.
These checks can detect irregularities such as:
Failures – Anomaly checking might be a last line of defence for performance-related issues. Despite the aim of perfect performance, hardware and software rarely achieve it. As a result, it’s always a good idea to keep an eye out for unusual behaviour.
Clock Skewing — For running code, many server and application functions rely on the server’s clock. The system may fail if the clock is off, or the application may return an invalid response if the clock is off. Time constraints on resetting passwords, for example, can cause user dissatisfaction if the clocks do not agree. The difference may cause the system to shut down in some cases.
Out-of-date Software — Bringing a server back online, especially one that has been offline for some time, can result in issues. Keeping the server up to date may not be enough to catch all faults.
Checking for abnormalities can aid in the detection of potentially obsolete software.
Anomalies occur for a variety of reasons, many of which are unknown. Checking for anomalous behaviour is therefore critical to server efficiency.
#5. Hardware Checks
Only when both software and hardware infrastructure are properly configured, the best performance is achieved.
You can avoid system slowdown and program lockup by keeping an eye on storage, memory, and CPU load.
Applications will stall and, depending on the logical volume setup, the operating system may crash if storage runs out of capacity.
The system will lag as a result of high memory and CPU utilization, and some apps may fail to function properly.
Server monitoring can trigger an alert, and historical monitoring can reveal whether your system’s resource requirements need to increase.
The server’s physical components, such as drives, fans, and power supplies, can also be checked for failure or irregularities.
Now that you know how to perform a Server health check, let’s see how often to perform a server’s health check.
How Often to Perform a Server’s Health Check
Regularly.
Monitoring the server health check is a continuous process. Although for small business that lacks an IT team under their sleeves, it can be a challenge to continuously monitor the server’s health.
Here’s where Sever health check tools can come in handy.
But, how?
Top Server Health Check Softwares
While server management tools come in varieties, each one focuses on monitoring and server health check online
We’ll go through the top server monitoring tools and their unique features;
#1. SolarWinds Server and Application Monitor
SolarWinds Server and Application Monitor or SAM is a multi-vendor server health monitor that displays relationships between applications and infrastructure components, allowing you to more readily correlate server health with performance issues and uncover root causes of issues to assist minimize application downtime.
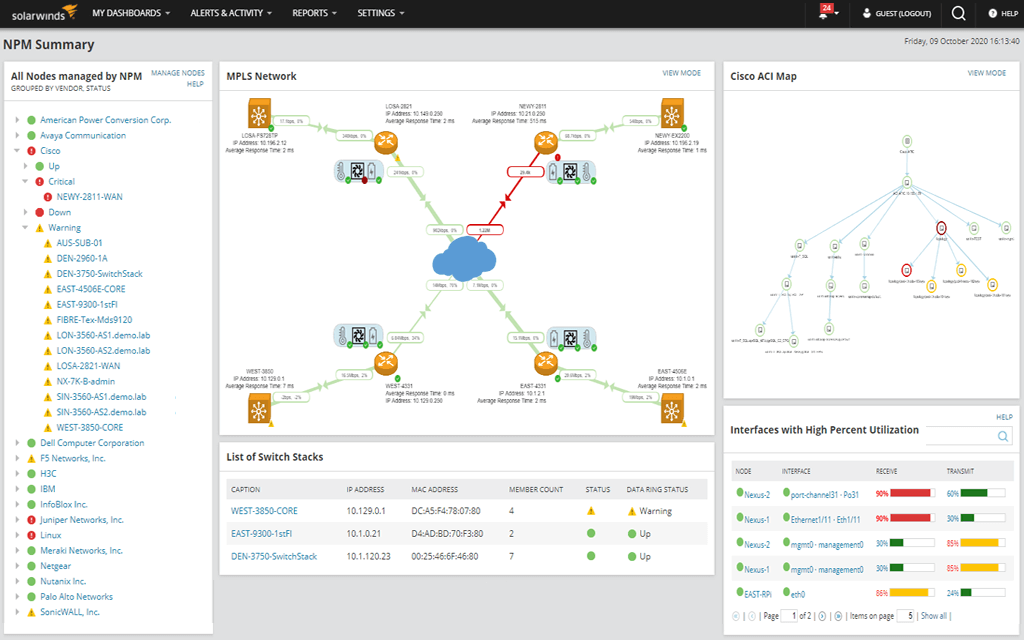
It has an intuitive interface that allows you to track server performance from a centralized device.
SAM makes it easier to monitor and enhance server health by enabling you to employ built-in server management operations from afar to tackle typical performance issues, such as:
- Real-Time Process Explorer – to help you identify resource hogs and eliminate processes that are slowing down your server.
- Service Control Manager – to manage services on your monitored servers, view information on stopped or running services, and take actions to start, stop, or restart services.
- Windows event logs – to view logs in real-time for faster error diagnosis and troubleshooting.
- Remotely reboot servers with a click.
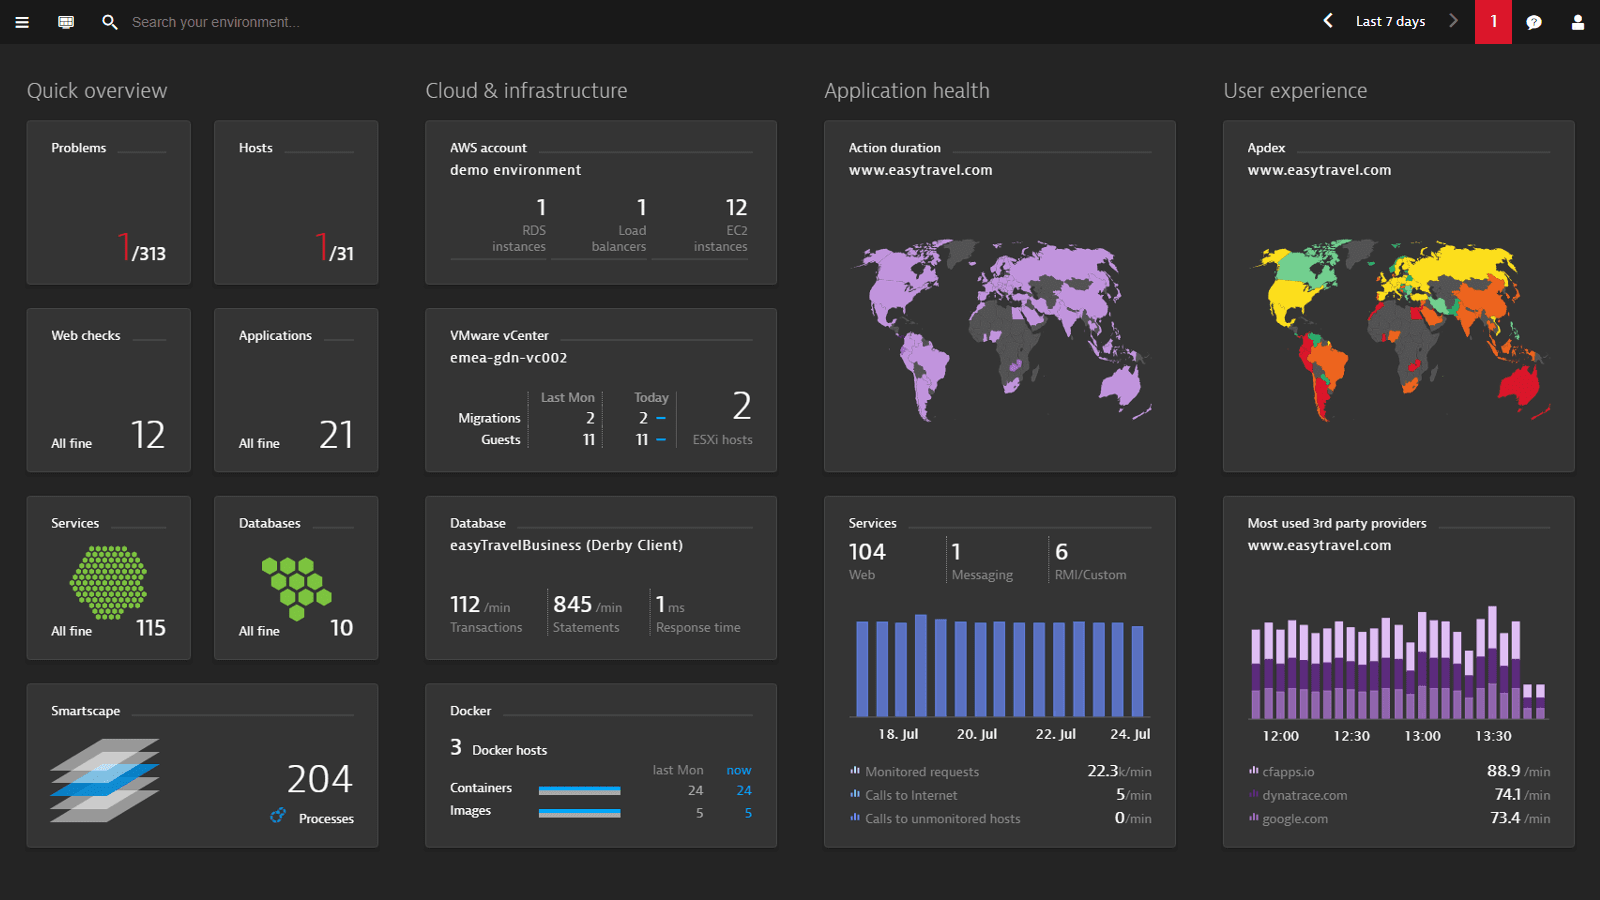
#2. Dynatrace
Dynatrace is a full-featured server performance monitoring solution with SaaS and on-premises versions available.
It can keep track of both server metrics and logs.
Dynatrace is simple to set up since it only takes a few minutes to feed your metrics into stunning dashboards and obtain insights into the CPU, memory, and network health of your servers down to the system level.
Dynatrace is a fantastic monitoring solution for your organization’s infrastructure scattered across various clouds, with low operational overhead and complexity.
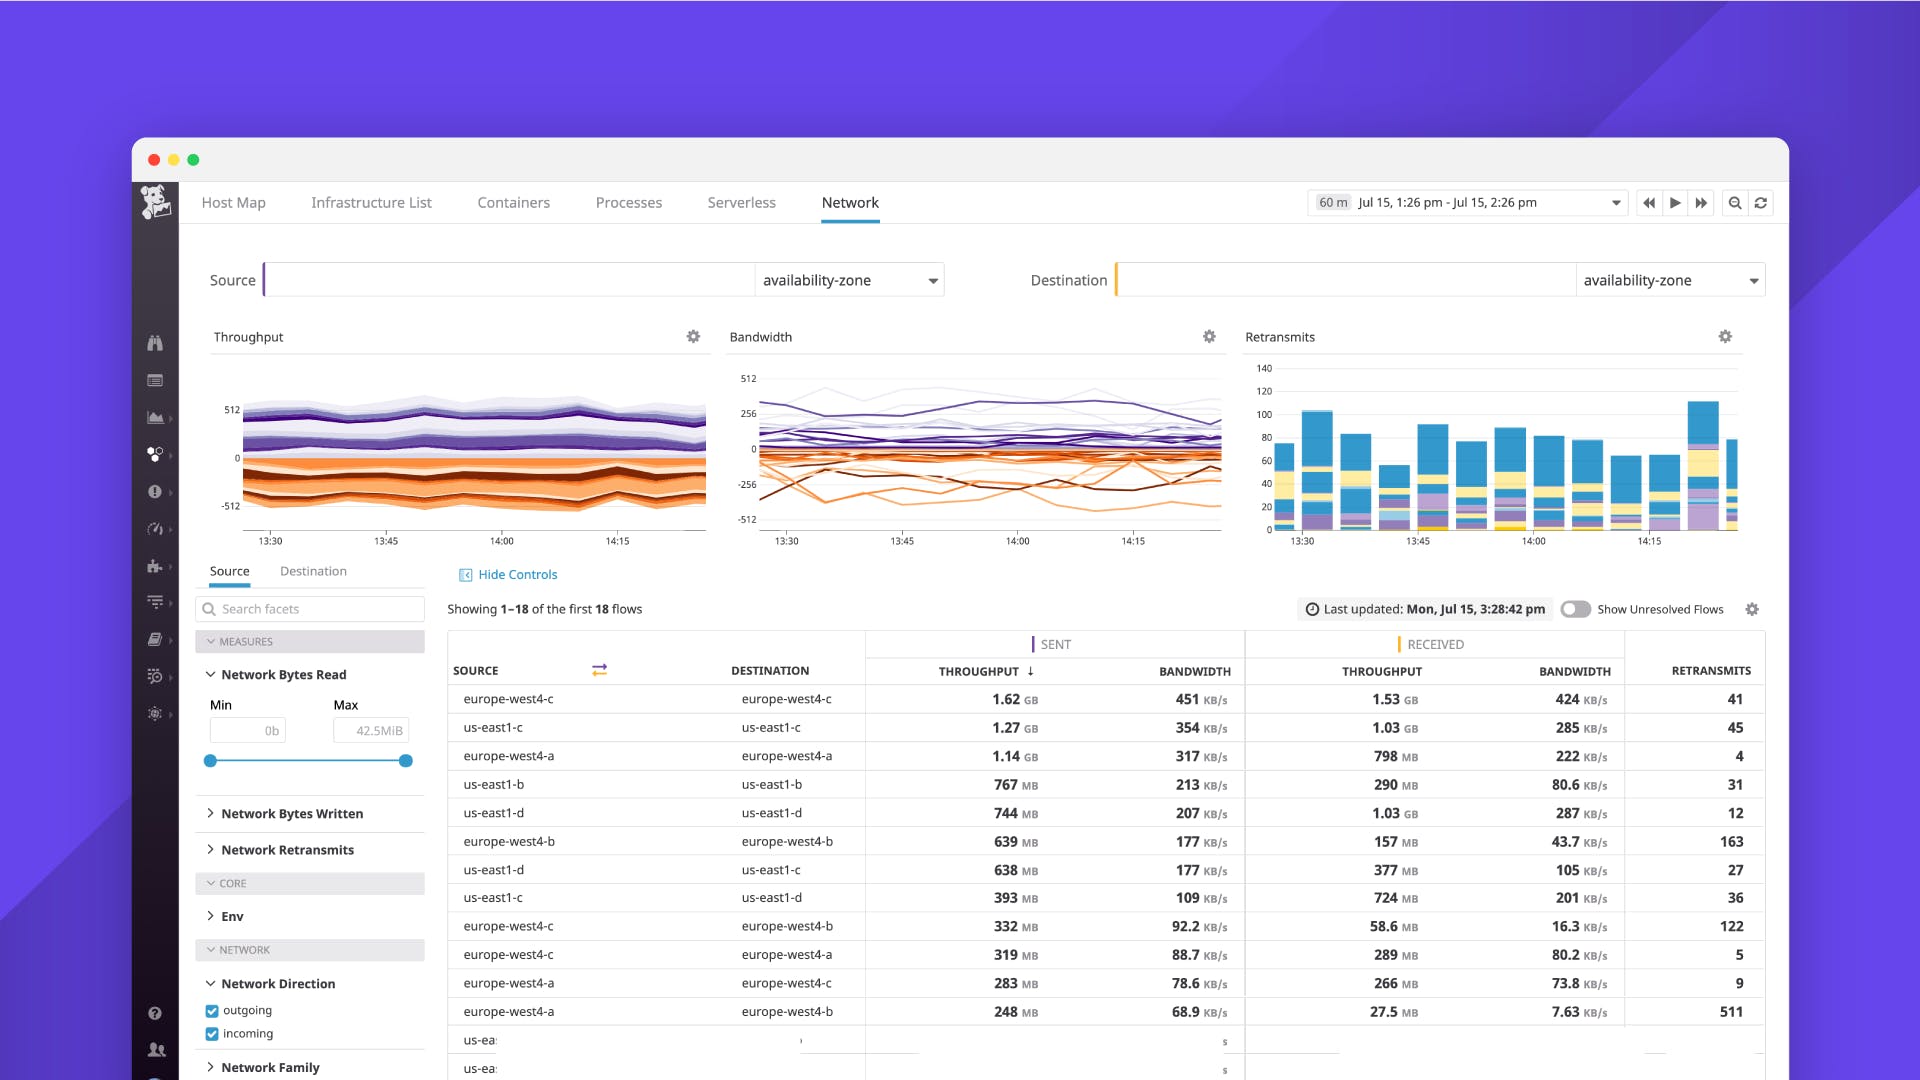
#3. Prometheus and Grafana
Prometheus and Grafana are a powerful open-source combination that gives you a lot of backend flexibility while offering outstanding server performance monitoring.
To submit metrics to Prometheus, you’ll need to install several data-gathering agents known as exporters, while Grafana allows you to construct beautiful dashboards based on those metrics.
Prometheus will run on your infrastructure, which means your measurements will not be sent to a third-party vendor.
Because this is a DIY solution, putting together a full-fledged server monitoring system using Prometheus and Grafana necessitates a significant amount of configuration and complexity.
#4. PRTG Network Monitor
Paessler PRTG is a network monitoring tool that both small and large businesses can use.
PRTG can monitor any IT-related resource that connects to your network, so it’s more than just a server monitoring solution.
The configuration is flexible, and monitoring capabilities can expand or contract as your company’s needs change.
It can also send email and SMS alerts based on configurable threshold levels, allowing you to fine-tune the sensitivity of certain servers such that critical servers receive more frequent warnings while non-critical servers receive almost no noise.
PRTG can keep track of everything you need to know about your server, including CPU usage, hard drive capacity and performance, RAM usage, and bandwidth usage.
Using ready-made templates can help speed up the installation and configuration process.
You can rapidly build graphs and analytics for specific requirements by customizing dashboards and reports, which allow you to monitor the entire server environment at a glance.
Other notable features include flexible alarm systems, a variety of user interfaces to choose from, failover-tolerant monitoring, distributed monitoring, and customizable maps and dashboards.
#5. Datadog
Datadog is a server monitoring system that keeps track of your infrastructure, applications, network, and logs.
It offers a single overview of monitoring with connected metrics associated with server log discovery and traces, which is one of its notable characteristics.
When debugging performance issues on your servers, this is a useful function.
You can detect hidden sources of latency, such as overcrowded hosts or contested databases, by monitoring server metrics alongside application data.
Alerts are quite conventional, and you can simply establish conditional alerts using a blend of metrics, events, and other data sources to reduce alert fatigue from noisy hosts.
Moreover, Datadog is easy to set up; all you have to do is install the metric-gathering agent.
You can view server health and monitoring information in real-time via stunning dashboards as soon as the agent is set up.
#6. (Bonus) OpsView Monitor
Opsview Monitor is a robust monitoring solution. It is simple to use and provides extensive monitoring and customization features.
Customizable dashboards, business service monitoring, alerts, reports and graphs, process maps, and infrastructure auto-discovery are some of the key features. The application, web servers, and other resources are all monitored by the OpsView Monitor.
Other Opsview products and add-ons, such as Elastic Stack for workflow automation and system monitoring, are compatible with Opsview Monitor.
It assists in the management of a wide range of infrastructures, including Windows Server and Active Directory, AWS, container orchestration frameworks, and hundreds of stand-alone applications.
This enables multinational support staff to discover problems before they affect consumers and present clients with an SLA dashboard.

Final Words
Health checks are an important component of maintaining a safe and secure operating environment, whether you perform them yourself or work with an expert IT service provider.
It might be difficult to navigate the world of web server issues.
That said, tools can help you ease and streamline your server health check process.
Tell us about your thoughts on server health checks or server health monitoring tools that were worth being on the list in the comments!
Next read – 8 Best Website Monitoring Tools for Reliable Uptime Checks.

Sakshi takes care of everything related to Marketing at Webscoot.io. She has knowledge about Magento, WordPress, and Dogs.


This is a very useful post.